By: Nathalie Crevoisier, Adam Kozak, Tarmo Nurmi
This data story is from the authors’ course project for the Applied Data Analysis course at the École Polytechnique Fédérale de Lausanne, from Fall of 2017.
Introduction
User reviews on Amazon.com are a source of interesting insight into people’s behavior on the internet. We decided to take a look into book reviews on Amazon over a period of time, to find answers to questions that interest us:
Research questions:
-
How can negativeness or positiveness of reviews and ratings influence the popularity of a book?
-
How do the sentiments of reviews evolve over time?
-
Can we see a snowball effect in reviews and ratings?
Before answering these questions, we need to examine the relationship between a text review and its associated rating, define the notion of ‘good’ and ‘bad’ books, and define what it means for a book to be ‘popular’.
Intermediate questions:
- Is there a discrepancy between a rating and its associated review’s sentiment?
- Do people give good ratings even though their comment is negative?
- How can we classify books into good, bad, and those for which there is no clear consensus?
The dataset we examine is the 5-core subset of Julian McAuley’s Amazon dataset, which spans reviews from May 1996 to July 2014. The data contains 8,898,041 reviews of 367,982 books, and each review has an associated star rating (1-5 stars). An example review looks like this:
{
"reviewerID": "A2SUAM1J3GNN3B",
"asin": "0000013714",
"reviewerName": "J. McDonald",
"helpful": [2, 3],
"reviewText": "I bought this for my husband who plays the piano.
He is having a wonderful time playing these old hymns.
The music is at times hard to read because we think the book was
published for singing from more than playing from.
Great purchase though!",
"overall": 5.0,
"summary": "Heavenly Highway Hymns",
"unixReviewTime": 1252800000,
"reviewTime": "09 13, 2009"
}
Immediately we notice that the identity of a book is given as the Amazon Standard Identification Number, ASIN. For a book this is the same number as its ISBN. Since actual book titles are nicer than numbers, we enrich the data by scraping the Amazon website for titles associated with ASINs, as well as more information on the book (genres, categories, etc.).
Ratings, reviews and sentiment
Now that introductions are out of the way, let’s take a look at the distribution of ratings in the data:
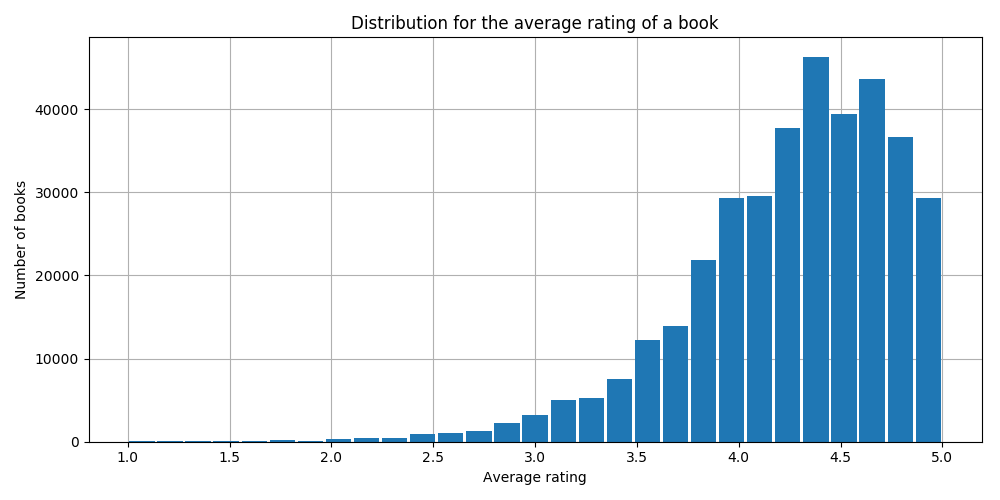
Wow, that looks pretty heavily left-skewed! Apparently, reviewers are giving significantly more high than low ratings. Does this distribution really represent the sentiment of reviewers, or are people just not inclined to give low numerical scores even though they might bash the book in the review text?
To see what kind of sentiments people express in their reviews, we use VADER sentiment analysis[1], which gives a compound score of a review on the positive-negative axis. The higher the score, the more positive the review, with -1 being as negative and +1 as positive as possible. Let’s see the mean VADER score distribution:
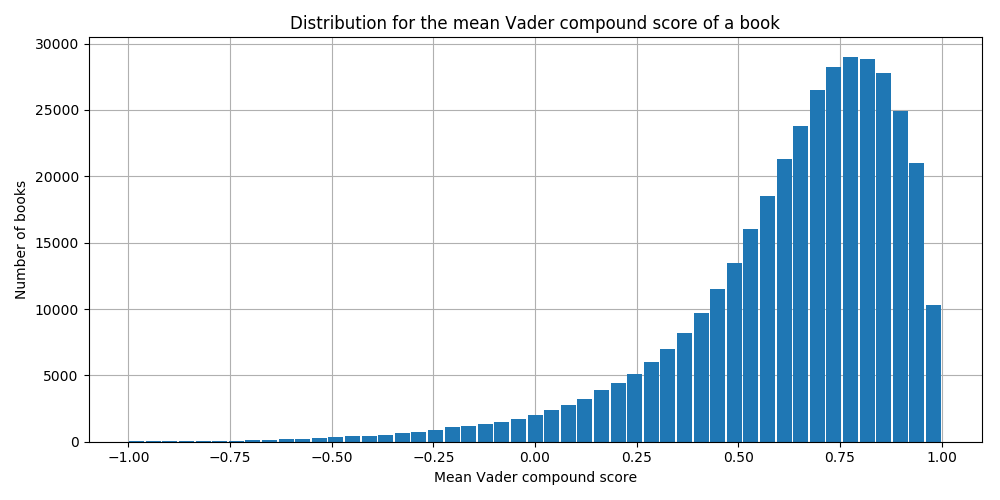
Looks pretty similar to the distribution of ratings. To really see if there is a difference between a rating and its associated review’s sentiment, we scale the ratings to the same [-1,+1]-range as the VADER score, and calculate the difference between the rating and the sentiment:
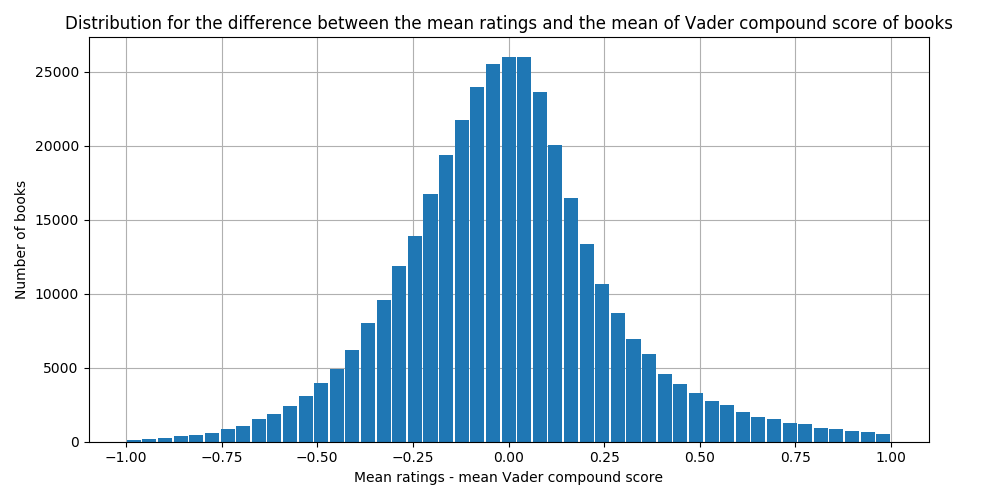
Excellent, most of the mass of the distribution is around zero, meaning there is little difference! Seems like people actually give a rating that accurately reflects the sentiment in their review. This means that we can use the star ratings as a measure of a reviewer’s sentiment towards a book.
Now that the rating-sentiment relationship is established, we can move to classifying books as good, bad or controversial.
Goodness and controversiality of books
Since most ratings are high in terms of numerical value, an absolute threshold for saying which books are good and which are bad is not sensible. Instead, we define bad books as the books with mean rating in the bottom 25 % of mean ratings, neutral books as the books with mean rating in the middle 50 % of mean ratings, and good books as the books with mean rating in the top 25 % of mean ratings. Therefore, goodness or badness is context-dependent, and books we say are bad or good are bad or good in this dataset’s context.
Now, we ask the question: do people agree on which books are good and which are bad? To answer this question, we create another classification — controversial, neutral, or uncontroversial. Here, we use the standard deviation of ratings, and classify the lowest 25 % as uncontroversial, middle 50 % as neutral and top 25 % as controversial. The idea is that the more variation there is among the ratings for a given book, the more people are in disagreement over the book’s goodness.
Since mean and especially variance can vary wildly if there are only a few data points, we classify only books with ratings from ten or more people. This reduces noise and exposes actual trends. After classification, we find the number of books in different classes:
| Uncontroversial | Neutral | Controversial | Total | |
|---|---|---|---|---|
| Good | 37761 | 11610 | 156 | 49527 |
| Neutral | 10801 | 69502 | 15415 | 95718 |
| Bad | 566 | 17142 | 33558 | 51266 |
| Total | 49128 | 98254 | 49129 | 196511 |
Out of the 367,982 books, 196,511 had at least 10 ratings, and the remaining 171,471 books had 9 or fewer and thus were not classified. The numbers of good and bad books or controversial or uncontroversial books are not exactly equal, because there are several books with mean rating or standard deviation exactly equal to the classification threshold values.
Most good books are also uncontroversial, and most bad books are also controversial. Partly this is due to the skewness in mean ratings, but the difference is still quite striking.
To gain a little more insight into these categories, we look at the genre distributions within them. Let’s check out the top ten genres in the good, bad, controversial and uncontroversial classes:
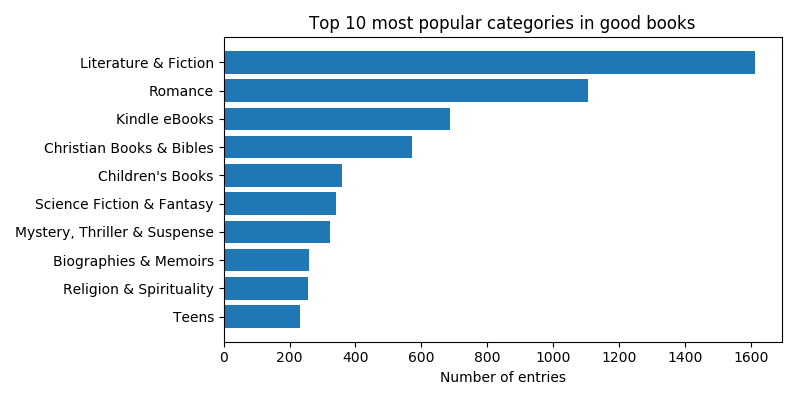
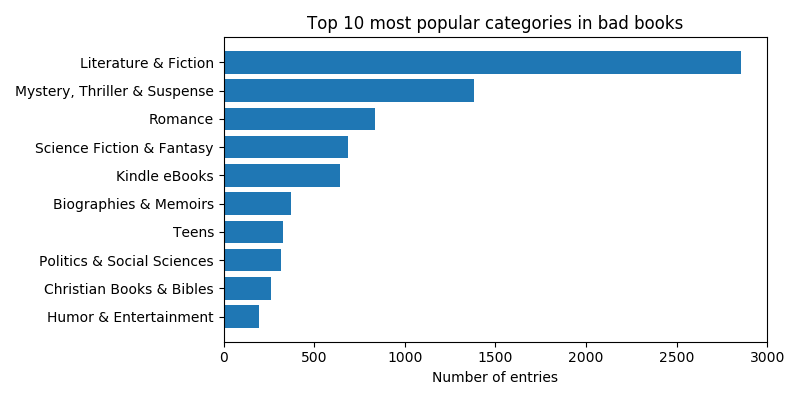
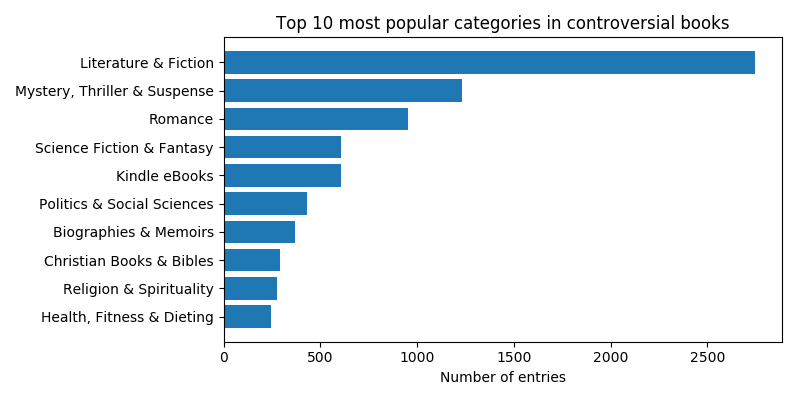
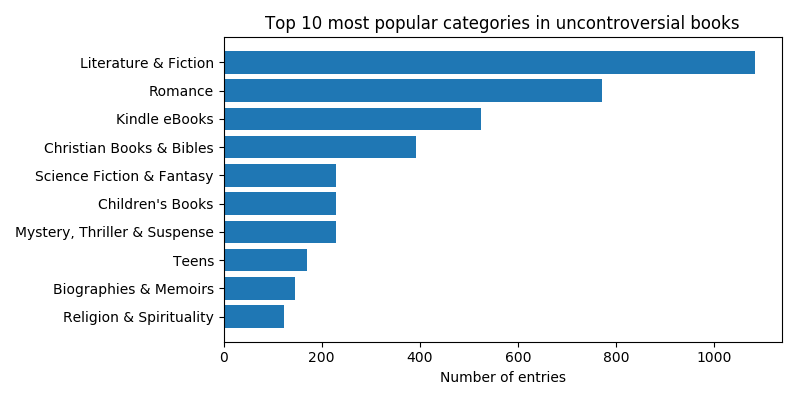
The main differences seem to be that Mystery, Thriller & Suspense and Politics & Social Sciences books are more represented among bad and controversial books than among good and uncontroversial (in fact, Politics & Social Sciences is not even in the top ten in either good or uncontroversial books).
Popularity of books
The popularity of a book is related to the amount of interest people show towards it. We decide to define popularity as the number of reviews a book accrues: the more popular the book, the more it is reviewed, and vice versa. But first, how many reviews are given in general during the time frame of the dataset? Let’s look at the number of reviews written per month:
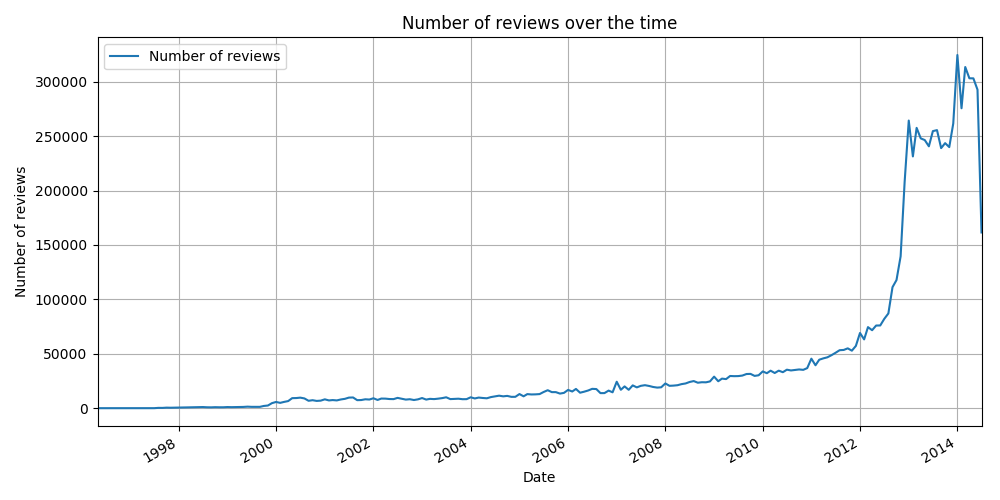
The vast majority of the reviews are written at the end of the time frame, from around January 2011 to July 2014. What happened around 2012 to warrant an exponential growth? Maybe the growth isn’t growth at all, but Amazon retroactively deleting older reviews en masse? Since this is something Amazon is not very public about, we can only speculate.
Regardless of background causes, the growth period is the most interesting part of the curve, since most of the overall popularity of a book is generated there. How does this timeframe look for our book classifications?
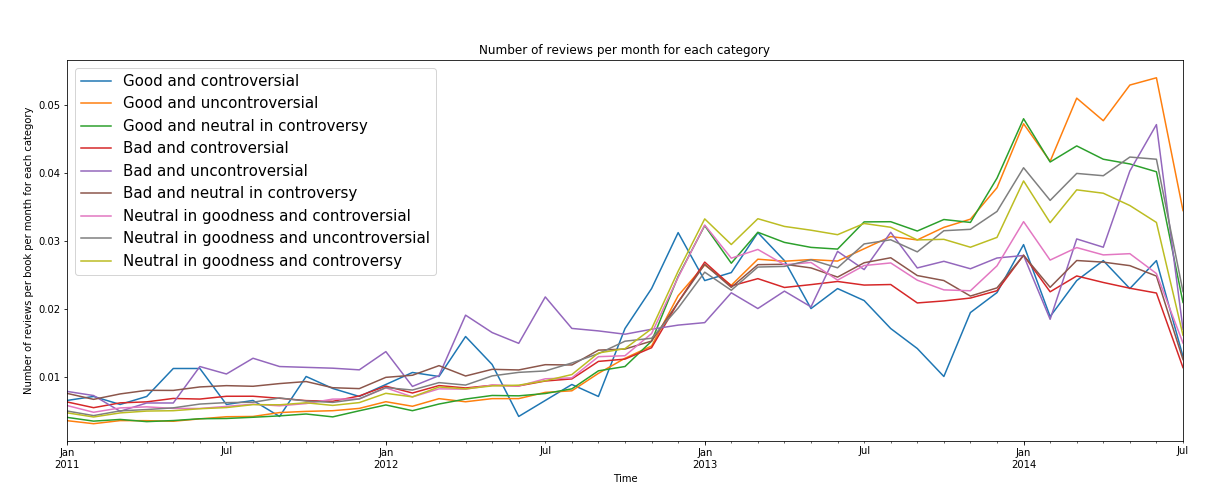
Surprisingly, uncontroversial books gain more popularity than controversial ones in each goodness category throughout the time frame! Good books that are uncontroversial or controversy-neutral gain the most reviews, and bad books gain fewer reviews. But, if a book is good and controversial, it will have variation in review numbers and eventually few reviews. Answering our first research question, How can negativeness or positiveness of reviews and ratings influence the popularity of a book?, we can say that good books are popular, but consistently so only if they are uncontroversial or controversy-neutral. If book reviews agree with each other, a book is more popular than if there is disagreement in reviews, and this effect is stronger than the actual positivity or negativity of the reviews!
Time evolution of reviews
How about the mean review score over the years? Let’s look at how the scaled review score and the VADER sentiment score evolve between 1999 and 2014:
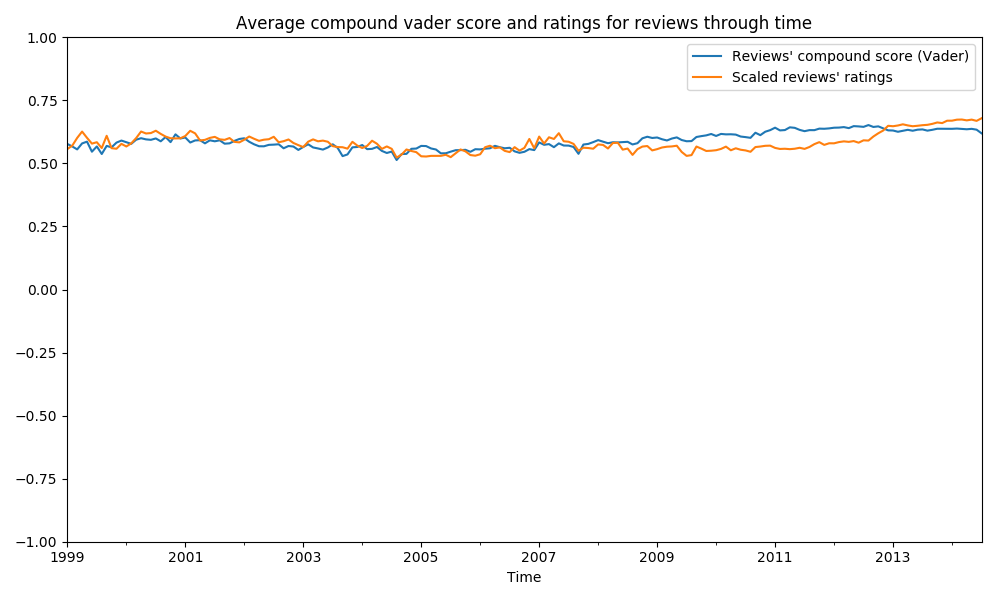
Pretty stable. How about we cut and rescale the y-axis a bit?

Especially in reviewers’ sentiments, there’s something of a downhill from 2001 to 2005, but after that we seem to be getting more positive reviews! The stability of the score indicates that even though there is small variation, the general attitude of reviewers has not become more negative (even though on the internet it might seem that we are constantly heading in a more grim and pessimistic direction in people’s behavior, at least Amazon reviewers keep a constant positive note).
To examine the temporal behavior of the numbers of reviews with respect to months and seasons, we plot for each month the percentage of reviews made in that month out of all reviews that year for the years 2000-2013.
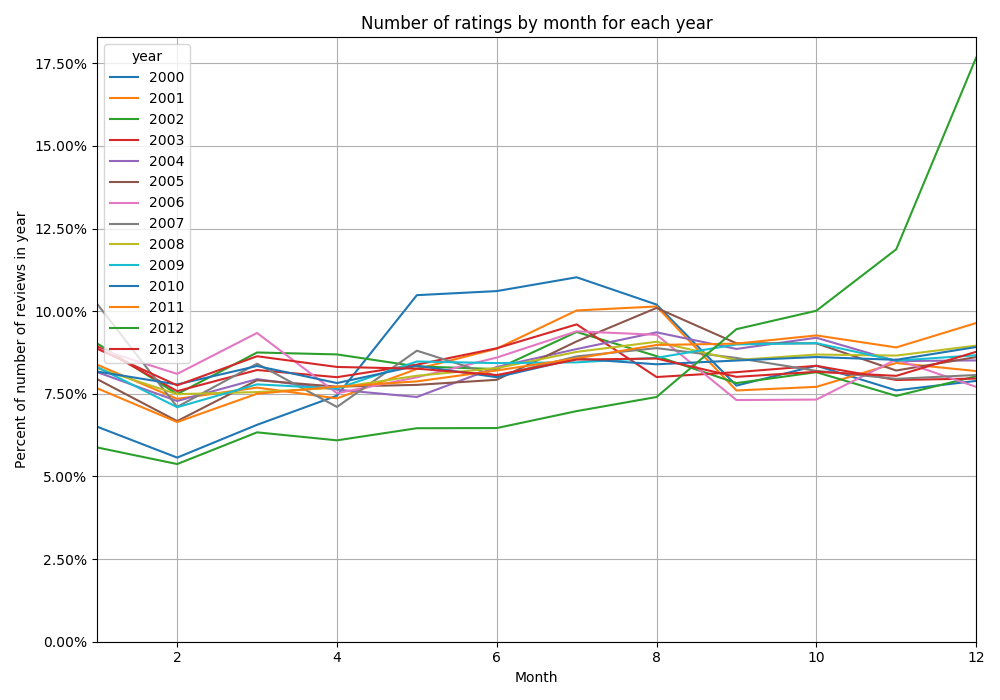
Again, the year 2012 jumps out as highly unusual. Otherwise, we see that there is a consistent drop in review numbers in February, while in the summer there is a small increase.
The snowball effect
We examine whether there is a discernible snowball effect in the ratings, i.e. do the first ratings dictate the final mean rating score of a book. In order to filter out noise, we only look at the books with 100 or more reviews. The mean of all ratings for a book against the mean of the first 25 ratings made on the book paints a clear picture:
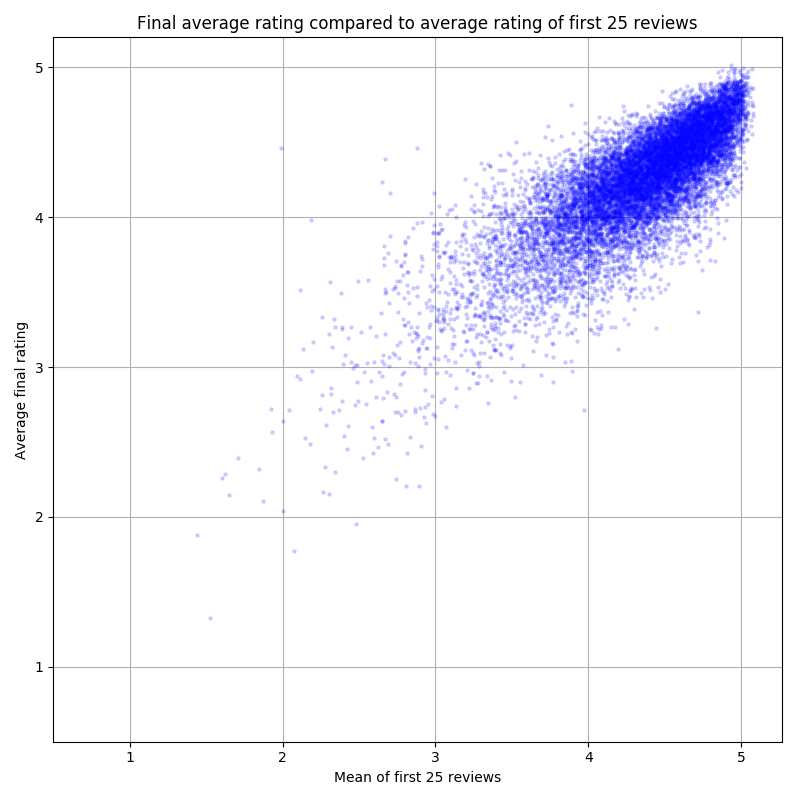
Jitter was added to discern data points from each other, hence some books seem to have a mean rating greater than 5. This is merely an illusion brought about by necessities in visualization!
The snowball effect is clear: the mean rating increases as a function of the mean of the first 25 ratings. Correlation does not imply causation, but this correlation tells us that if the mean of the first 25 ratings is high, the overall mean rating is high as well. For low first ratings, the effect is less pronounced and there is more variation — bad intial ratings can coexist with a good overall rating.
Conclusion
We have seen that uncontroversiality and goodness (high mean rating) are key to popularity of books, and that controversial books are less popular than uncontroversial ones in each goodness category. The average sentiment of an Amazon book review has remained stable and quite positive over the years 1999-2014, which is good news for those fearing for ever-increasing gloominess on the internet. The reviews themselves experience a snowball effect, where early ratings are heavily correlated with the mean rating after lots of reviews have been made.
References
[1] Hutto, C.J. & Gilbert, E.E. (2014). VADER: A Parsimonious Rule-based Model for Sentiment Analysis of Social Media Text. Eighth International Conference on Weblogs and Social Media (ICWSM-14). Ann Arbor, MI, June 2014.